Visualizing the brave new world of data
Visualizing the Brave New World of Data
Data is now one of the most important assets a company can own, and understanding how to valuate it is more crucial than ever. With the help of some very smart people at Hewlett Packard Enterprise and a talented illustrator, we explored the new frontiers of data valuation, packaging the information in a compelling, visually digestible format.
Hewlett Packard Enterprise
Branded content
Editorial writing
Infographics
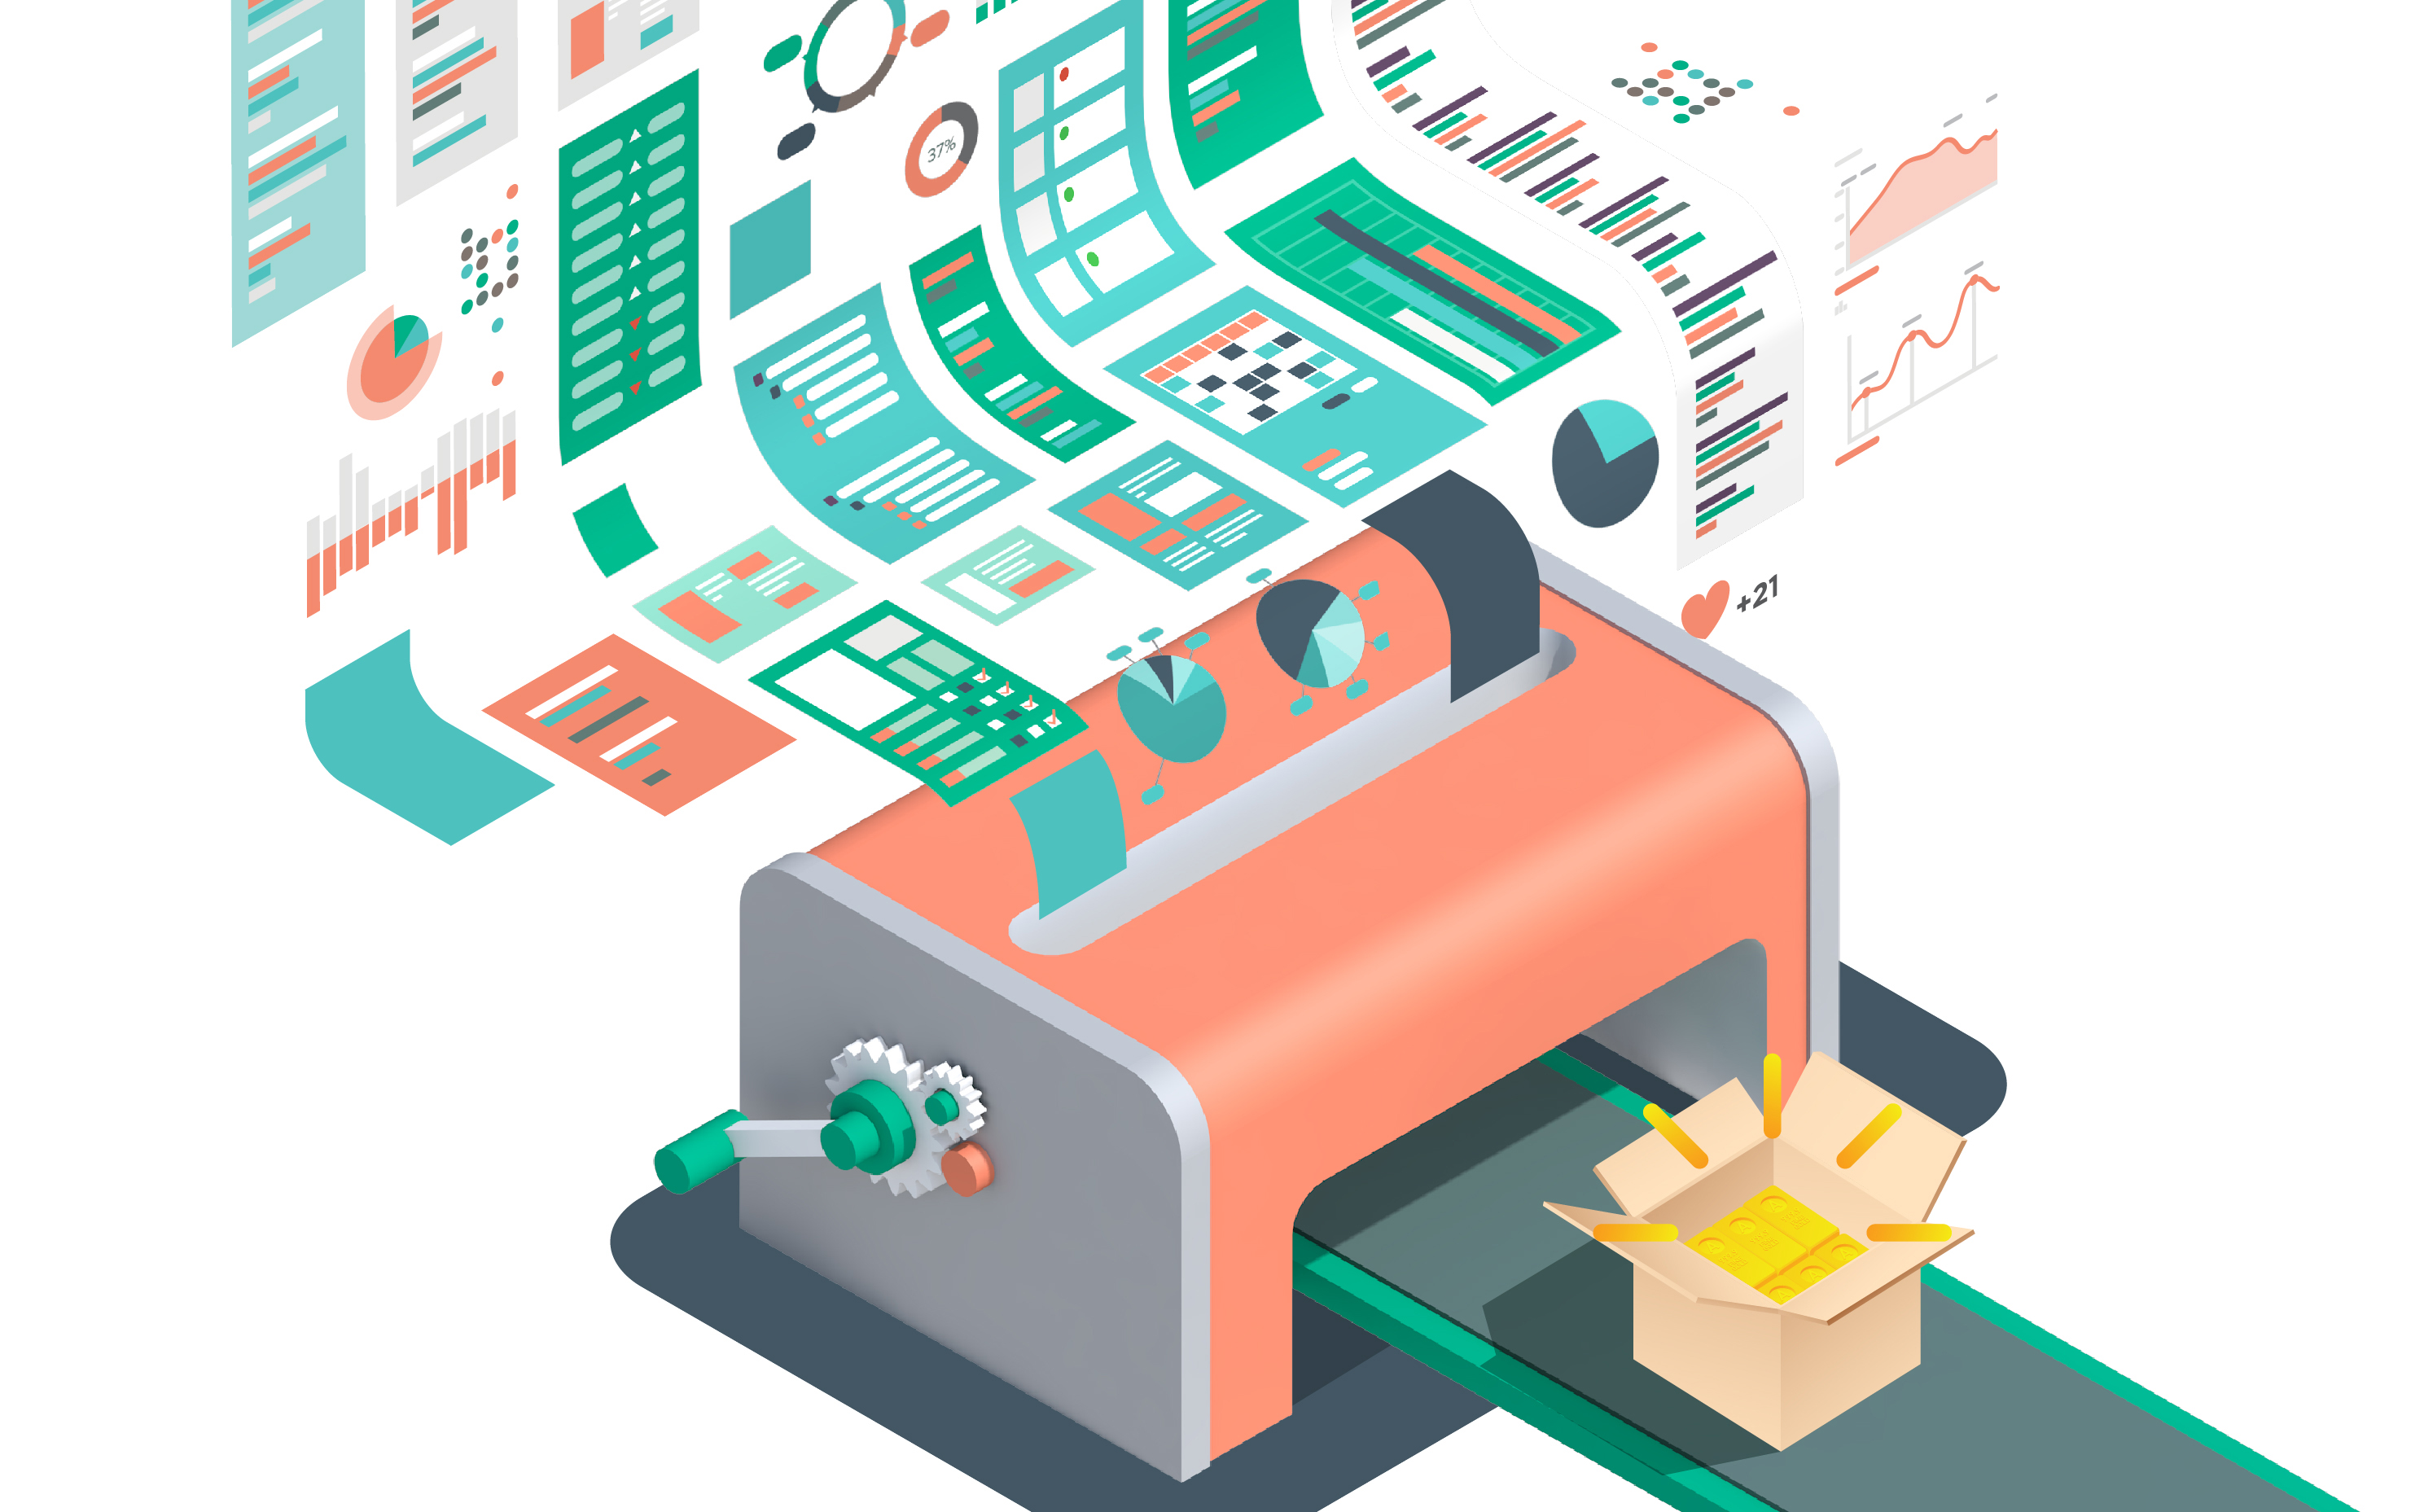
Data is the New Currency
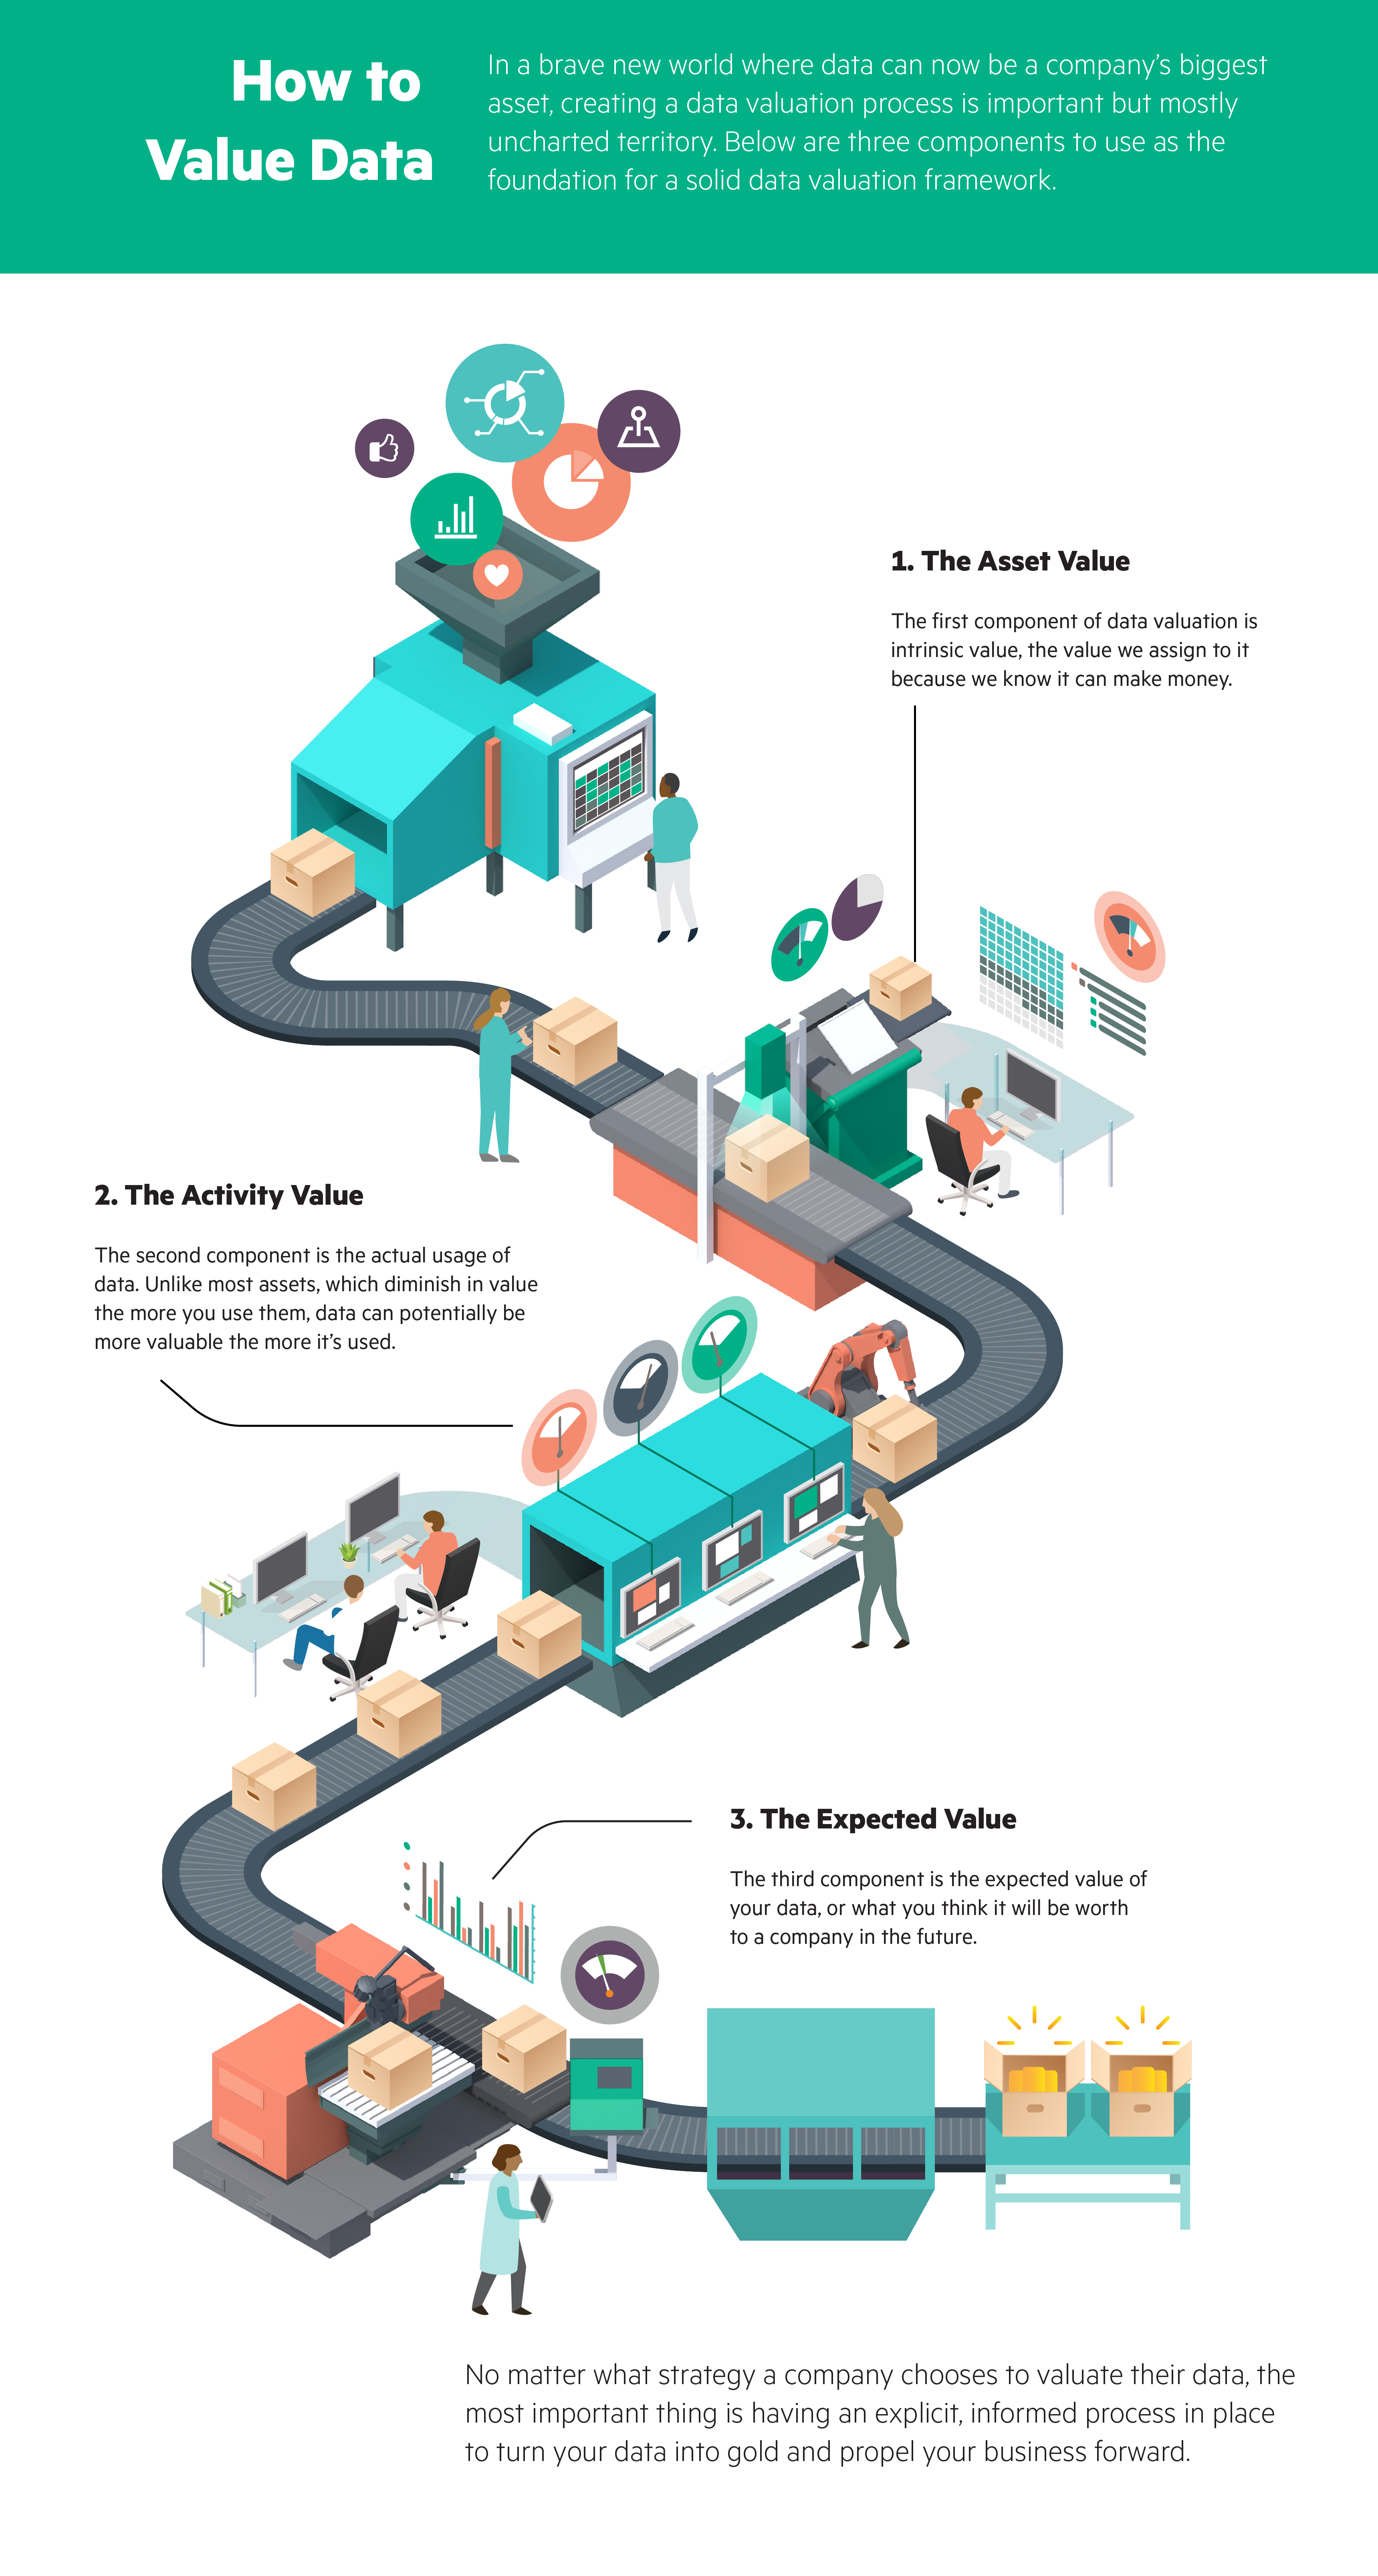
To explore the vast and uncharted territory of data, we wrote a two-part series called “Toward a New Data-Based Economy.” In Part One, “Data is the New Currency,” we covered the ins and outs of data valuation – or in other words, how you know what your data is actually worth. We interviewed Jim Short, a leading data valuation expert, and consolidated his research into a three-step process, visualized below.
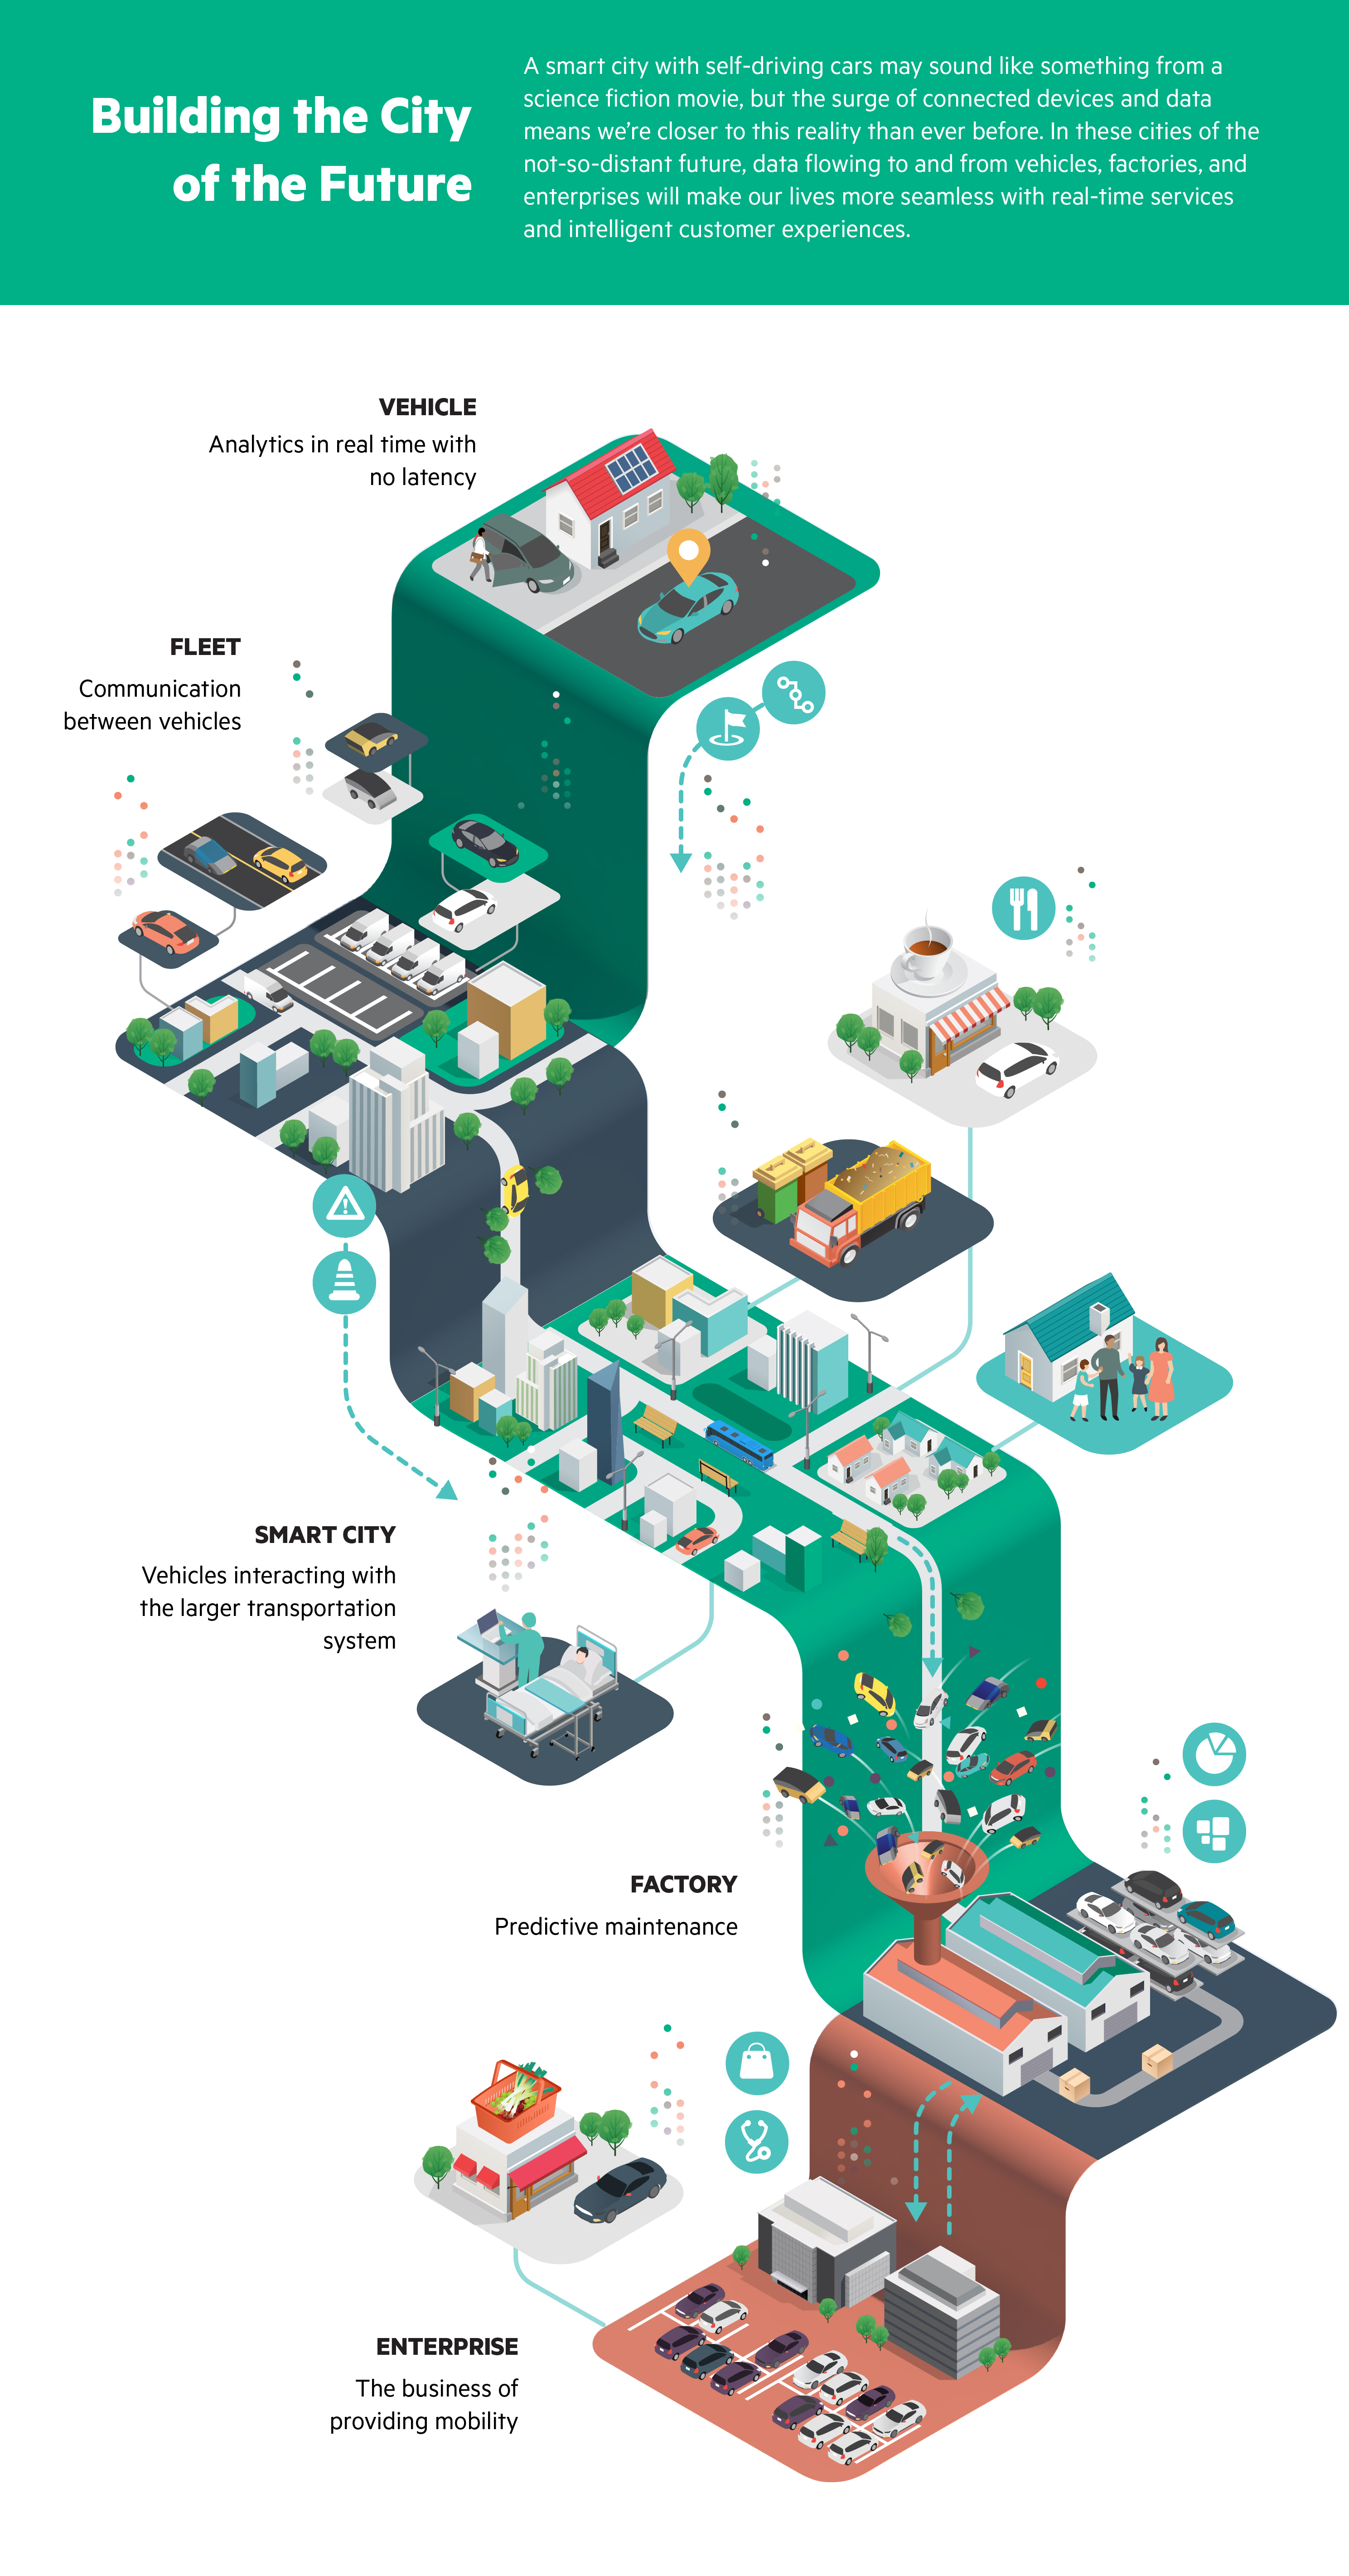
In Part Two, “The Smart City is the Data Economy Made Manifest,” we explored a real-world application of data in the context of a smart city. Smart cities adapt to data as it flows in and enhances its residents' living environments accordingly. We broke down a very complex diagram of multiple data flows into something digestible and visually appealing.
In Part 2, “The Smart City is the Data Economy Made Manifest,” we explored a real-world application of data in the context of a smart city. Smart cities adapt to data as it flows in and enhances its residents' living environments accordingly. We broke down a very complex diagram of multiple data flows into something digestible and visually appealing.

Previous project
Next project
Next project